
產品容易修,為什麼客戶還是選擇換新?
結合歐盟維修規則、JRC維修性方法與Fairphone服務入口,分析可拆設計如何轉化為可完成、可負擔的維修,並用情景模型檢查經濟邊界。
Topics & keywords
The business value of repairable design depends on completing a reliable service transaction: diagnosis, available parts, an understandable quote, a successful repair and tolerable waiting. Accessible screws solve only one part.
Sources checked on 24 October 2026. Rules have product and jurisdiction boundaries; company support pages show service access. Scenario calculations do not establish actual repair success, brand profit or lifecycle emission reductions.
1. Customers buy restored use
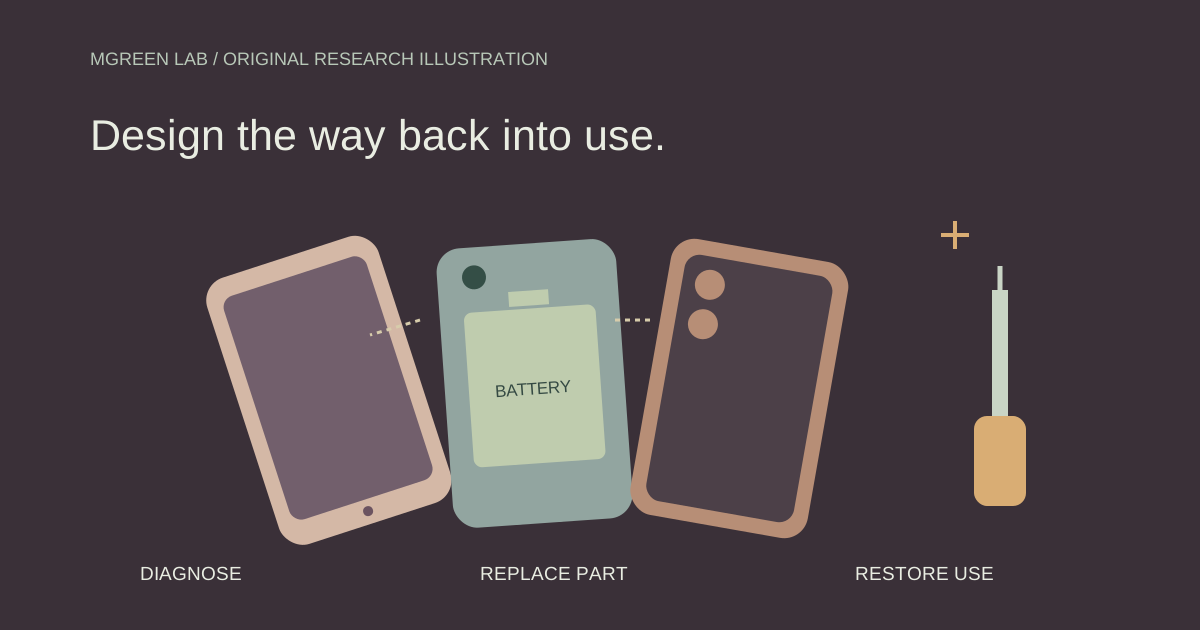
At failure, the customer faces search, uncertainty, shipping, waiting and failure risk alongside the repair price. A design that is easier to disassemble may still fail to restore use without parts, information and service.
Acceptance should progress from possible disassembly to who can complete a repair under which conditions. Observe completion, first-time fixes, waiting and total-price distributions by failure type. A demonstration video cannot substitute for a real repair journey.
2. A repairability score maps capability
JRC describes an A-to-E repairability class for smartphones and tablets, considering disassembly depth, fasteners, tools, spare parts, software updates and repair information.[1] This is a multi-parameter assessment, not a claim that modularity alone guarantees the easiest repair.
The score can inform procurement comparisons, but it does not guarantee a successful individual repair, free service or local stock. Product teams should connect each design capability to evidence of service delivery rather than treating the label as the endpoint.
Figure 1 · From assessment factors to service evidence
| JRC assessment factors [1] | Additional delivery evidence (editorial framework) |
|---|---|
| Disassembly depth, fasteners, tools | Verify disassembly and safety by failure type |
| Spare part availability | Local stock, lead time and complete quote |
| Software updates, repair information | Diagnostic access, authorisation and restoration test |
3. Rules and service reality in 2026
The Commission states that Member States had to transpose and apply the repair-of-goods directive from 31 July 2026. Manufacturer obligations concern Annex II goods already subject to EU repairability requirements, including reasonable price and time.[2] This does not establish implementation in every country or coverage of every product.
Fairphone’s repair entry point connects diagnosis, repair tracking, guides and send-in service.[3] It illustrates a repair journey, not measured repair success, waiting or profitability for the whole customer base. Availability still needs checking by market and model.
4. Specify whose economics are being calculated
The following model considers a consumer’s immediate cash outlay for one repair attempt. Let replacement cost be R, attempt cost incurred whether successful or not be C, and success probability be p. If failure is followed by replacement at R, expected spending is C+(1−p)R, and the difference from immediate replacement is pR−C.
With illustrative R=CNY 3,000, C=CNY 600 and p=80%, expected outlay is CNY 1,200, or CNY 1,800 below immediate replacement; the cash break-even success probability is 20%. This is not a saving forecast. The comparison is useful only for comparable service needs and boundaries; remaining life, downtime, data migration, residual value and warranty need separate assessment.
Figure 2 · Conditional tree for one repair attempt
Incurred on either outcome
Immediate outlay C
Then replace: immediate outlay C+R
Weighted expected outlay=pC+(1−p)(C+R). Not a full equal-lifetime cost comparison.
Interactive · Change assumptions, not a forecast
Expected cash=C+(1−p)R; avoided cash=pR−C; break-even p=C/R (R>0).
5. Consumer saving is not brand profit
A brand must separately account for parts inventory, diagnostics, service labour, logistics, repeat repairs and warranty obligations. Repair revenue may not cover inventory and operating investment. A customer’s CNY 1,800 saving is not CNY 1,800 in brand profit.
A pilot can focus on one frequent failure and one region, comparing actual costs, restoration time and recurrence between repair and replacement journeys. Safety-critical or complex faults require service appropriate to the risk and qualifications; not every repair belongs with the consumer.
Worksheet · Which evidence remains unconfirmed?
6. Connect product design to service delivery
A bounded engagement can include failure-journey research, disassembly and diagnosis tests, parts and quote information, a service-flow prototype and cost worksheet. Acceptance should assess whether users can find the correct part, understand the price and complete restoration, alongside interface quality.
Mgreen Lab can discuss research at these product-service interfaces. Use the worksheet to record the fault, participants, time and costs before deciding whether structure, information or service should change. Repair is not presumed cheaper in every case.
Take the worksheet and define a concrete need
Download bilingual worksheet (Markdown)
Discuss requirements with Mgreen Lab7. Judgement and sources
Repairable products merit investment when design capability, service supply and customer economics align. The strongest evidence explains how a specific failure can be resolved reliably at an acceptable cost.
Evidence and boundaries
- JRC — New EU labels to help consumers choose more repairable electronics2025-06-20 · Accessed: 2026-10-24Smartphone/tablet assessment method; not measured repair success, free repair or local availability.
- European Commission — Directive on repair of goodsApplication deadline 2026-07-31; checked 2026-10-24 · Accessed: 2026-10-24Not all goods; national transposition status not individually verified; not case-specific legal advice.
- Fairphone — Repairs made easyUndated current service page; checked 2026-10-24 · Accessed: 2026-10-24Service journey illustration, not an audit of success, stock or profit; check model and region.
Related: Green material value · Data-centre resources
可维修设计的商业价值,取决于故障后能否完成一笔可靠的服务交易:问题能诊断、零件能买到、报价能理解、维修能成功、等待可以接受。螺丝容易拧开,只解决了其中一段。
本文截至2026年10月24日核验资料。法规说明产品与地区边界,企业支持页面展示服务入口;情景计算不代表实际维修成功率、品牌利润或生命周期减排。
一、客户购买的是恢复使用
故障时,用户面对的不只是维修费,还包括搜索、判断、寄送、等待与失败风险。结构设计降低拆装难度,如果没有对应的零件、说明和服务,仍可能无法恢复使用。
所以设计验收要从“能够拆”推进到“谁能在什么条件下修好”。应观察完成率、首次修复、等待时间和总报价的分布,并按故障类型区分;不能用一次演示视频替代真实维修过程。
二、维修性评分是一张地图,不是成功保证
JRC说明,欧盟智能手机和平板维修性等级从A到E,方法考虑拆解深度、紧固件、工具、备件、软件更新和维修信息六方面。[1] 这是一种多条件评估,不能缩成“模块化就一定最好修”。
评分有助于采购比较,但不说明某次故障必修成功、维修免费或当地服务有现货。产品团队应将每一项设计能力与售后交付证据连接,而不是把标签作为终点。
图1 · 从评分因素到服务证据
| JRC评分因素 [1] | 需要补充的交付证据(编辑建议) |
|---|---|
| 拆解深度、紧固件、工具 | 按具体故障验证拆装及安全 |
| 备件可用性 | 当地库存、交期、完整报价 |
| 软件更新、维修信息 | 诊断入口、授权条件和恢复测试 |
三、2026年的规则与服务现实
欧盟委员会说明,成员国应自2026年7月31日起转置并适用维修商品指令。制造商维修义务针对附录II列出、已受欧盟维修性要求约束的产品,并涉及合理价格和时间。[2] 这不是所有产品、所有国家均已完成实施的证明。
Fairphone 的公开维修入口把诊断、维修追踪、指南与寄修服务联系起来。[3] 案例展示的是如何让维修进入用户流程;页面本身没有证明全体客户的修复率、等待时间或盈利水平。不同市场和机型还需要核查实际可用条件。
四、先算清楚谁的经济账
下面从消费者的即时现金支出看一次维修尝试。设换新支出R、无论成败都发生的尝试成本C、成功概率p;失败后仍支付R换新,则预期支出为C+(1−p)R,比立即换新少pR−C。
演示R=3000元、C=600元、p=80%,预期支出1200元,较立即换新少1800元;即时现金平衡概率为20%。这不是节省预测。只有服务需求和比较边界可比时才有解释价值;剩余寿命不同、停机、数据迁移、残值和保修应另行评估。
图2 · 一次维修尝试的条件树
无论成败都发生
即时支出 C
再换新:即时支出 C+R
加权预期支出=pC+(1−p)(C+R)。不是相同使用寿命下的完整成本比较。
交互 · 只改变假设,不预言结果
Expected cash=C+(1−p)R; avoided cash=pR−C; break-even p=C/R (R>0).
五、品牌收益不能用消费者节省代替
品牌需要另算备件库存、诊断支持、服务工时、物流、重复维修和保修责任。维修收入增加,不一定补偿库存和运营投入;用户节省1800元,也不表示品牌赚了1800元。
可行的试点可以限定一个高频故障和一个地区,比较维修路径与换新路径的真实成本、恢复时间和后续复发。对安全关键或复杂故障,应按风险和资质安排专业维修,不把所有任务转给消费者。
工作表 · 哪些证据还没确认?
六、从结构设计走到服务设计
一项有边界的委托可以包括故障旅程研究、拆装与诊断测试、备件和报价信息设计、维修流程原型以及服务成本表。验收应落在用户能否找到正确零件、理解价格和完成修复,而不仅是界面是否好看。
Mgreen Lab 可围绕产品与服务之间的这些衔接讨论研究需求。先用下方工作表记录故障、参与者、时间与成本,再决定需要改结构、信息还是服务;不预先承诺维修一定比换新划算。
带走工作表,讨论一个明确需求
与Mgreen Lab讨论需求七、判断与资料
可维修产品值得投入的条件,是设计能力、服务供给和客户经济性能够一起成立。最有说服力的证据不是“我们支持维修”,而是一个具体故障如何被合理地、可靠地解决。
证据与适用边界
- JRC — New EU labels to help consumers choose more repairable electronics2025-06-20 · 访问:2026-10-24智能手机和平板评分方法;不表示实际修复率、免费或当地库存。
- European Commission — Directive on repair of goodsApplication deadline 2026-07-31; checked 2026-10-24 · 访问:2026-10-24并非全部商品;未核验每国转置情况,不能视作个案法律建议。
- Fairphone — Repairs made easyUndated current service page; checked 2026-10-24 · 访问:2026-10-24服务入口展示,不是修复率、库存或盈利审计;按机型和地区核查。