
Perovskite–silicon tandems: from efficiency records to bankable products
Efficiency gains are established; scalable value still needs evidence. Device and module data, the Oxford PV case, and an interactive cost model reveal what commercialization must prove.
Topics & keywords
The central question for perovskite–silicon tandem photovoltaics has moved from whether conversion efficiency can improve to whether that improvement can deliver repeatable lifetime energy value. This article draws on primary public sources checked on 16 October 2026 and separates research devices, demonstration modules, commercial deliveries and company targets. The selected milestones are a snapshot, not an exhaustive ranking of current world records.
Mgreen Lab’s assessment is that the next competitive unit is a verifiable product system: efficiency, manufacturing yield, reliability, system cost, warranty support and end-of-life handling must work together. The procurement framework below is editorial analysis. The interactive model is a transparent scenario calculation, rather than a supplier quotation or measured project return.
01 / Why tandems work, and why manufacturing remains difficult
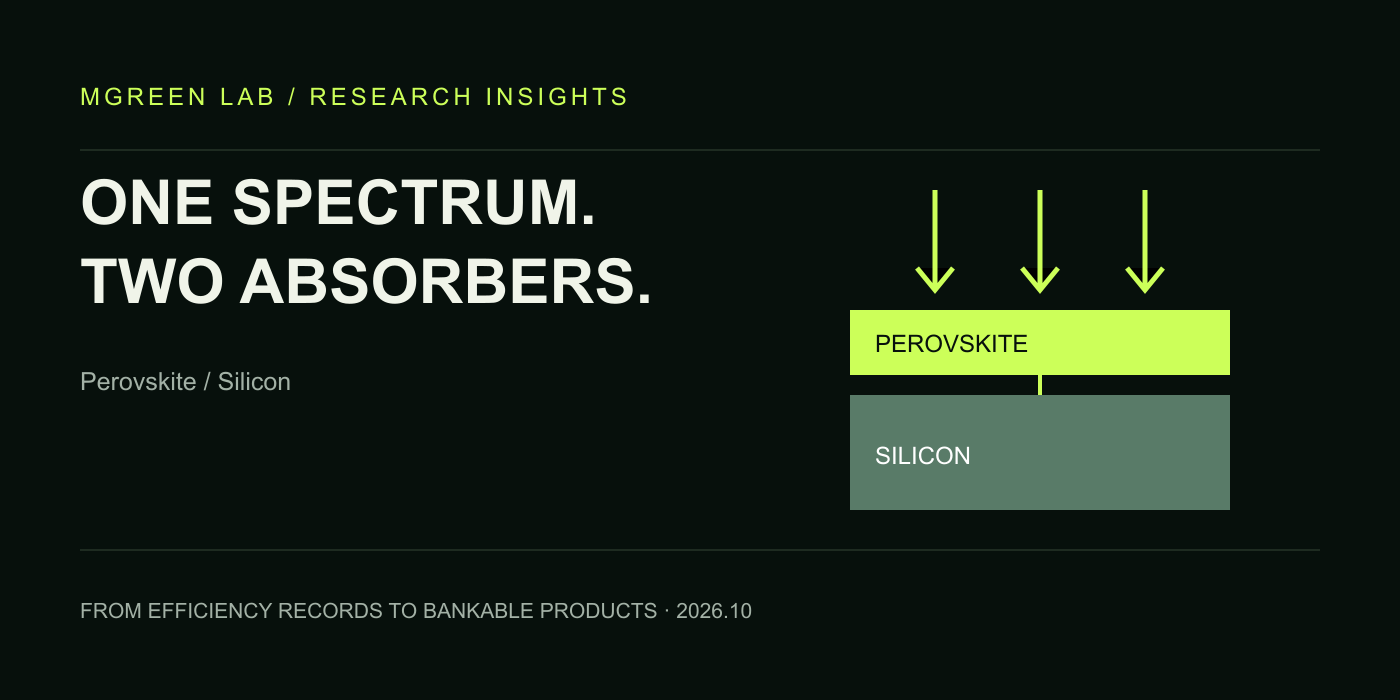
A single absorber cannot use every part of the solar spectrum equally well. A tandem assigns different wavelength ranges to absorbers with different bandgaps: a wider-bandgap perovskite above silicon can reduce thermalization losses while preserving the use of longer wavelengths. In a common two-terminal device the subcells are connected in series, making current matching important. Changes in spectrum and temperature can alter their relative output, so a nameplate efficiency alone does not predict annual energy yield.
A 2017 study demonstrated a 23.6%-efficient, 1 cm² monolithic two-terminal tandem and investigated barrier layers and damp-heat stability. [10] Subsequent advances in passivation, transparent contacts and film formation address device losses. Uniform coating of industrial textured wafers, low defect density and compatibility with encapsulation remain distinct engineering tasks. Any comparison therefore needs area, area definition, architecture, measurement method and certification status alongside efficiency.
02 / Efficiency: read the evidence level before the percentage
The chart uses a common zero-based axis but separates cells, modules and delivered products. Different sample areas and measurement conventions prevent it from being a product league table. LONGi reported a 34.85% tandem cell certified by NREL and a 27.81% silicon cell certified by ISFH in April 2025; the same announcement cited a 30.1% M6-sized tandem milestone from 2024. [1] None is a mass-produced module rating.
A 2025 study reported certified efficiency of 28.9% on 60 cm² active area, giving a quantified example of area scaling. [4] Oxford PV’s 26.9% figure is the designated-area efficiency of a 2024 demonstration module measured by Fraunhofer CalLab; its first commercial shipment announcement instead specified 24.5%. [2][3] A matrix-shingled module demonstration in 2026 reported 25.6% across the entire module area. [7] These differences do not describe deterioration of one product over time.
Efficiency comparison / selected milestones
Conversion efficiency % · common 0–40% axis; different area conventions prevent direct product ranking.
Research cells
Demonstration modules
Commercial shipment specification
03 / Oxford PV: what a commercial delivery establishes
On 5 September 2024, Oxford PV announced its first shipment of 72-cell tandem modules to a US customer for a utility application, using cells from its megawatt-scale pilot line in Brandenburg, Germany. [3] This supports market entry. The announcement does not provide auditable long-term field degradation, batch yield, transaction prices or customer returns. We classify it as a company-disclosed commercial shipment and do not infer an industry-wide cost advantage.
The company’s “up to 20% more energy” claim also needs a comparator and operating conditions. Under equal area, irradiation and system losses, 24.5% versus an assumed 23% efficiency gives a 6.5% nameplate gain; versus an assumed 21%, it gives 16.7%. These are arithmetic scenarios, not field measurements of the commercial project. A project comparison needs annual energy under its own spectrum, temperature, shading and inverter conditions.
04 / Industrialization: research, shipment and licensing are different events
Industrialization has no single launch date. Efficiency certification concerns a sample; shipment concerns a customer application; a patent licence concerns rights to use intellectual property. In April 2025, Oxford PV and Trinasolar announced an exclusive patent licence for manufacturing and/or sales in China, including sublicensing rights. [5] Such agreements can support diffusion without establishing production yield or final module output.
The non-exclusive US patent licence announced with First Solar in February 2026 explicitly excludes crystalline silicon semiconductors. It should not be described as First Solar buying a perovskite–silicon production line. [6] The June 2026 Fraunhofer ISE collaboration concerns module interconnection and integration. [7] Oxford PV’s website targets module efficiencies of 27% in 2027 and 30% in 2030; these are roadmap targets, not delivery specifications verified here. [11]
Industrialization timeline / events and targets
- Research23.6% monolithic two-terminal tandem [10]
- Demonstration26.9% designated-area module [2]
- ShipmentFirst commercial shipment to a US customer [3]
- LicensingTrinasolar patent licence for China [5]
- CertificationLONGi 34.85% tandem cell [1]
- LicensingFirst Solar · crystalline silicon excluded [6]
- Demonstration25.6% total-area shingled modules [7]
- TargetsOxford PV · 27% / 30% module roadmap [11]
05 / The commercialization gap: turn missing evidence into tests
The evidence matrix is a due-diligence framework inferred from public sources, rather than a company scorecard. Evidence not found in this review does not mean a company lacks it. Buyers should request batch distributions, stabilized power and manufacturing yield. Modules require validation of interconnection, encapsulation, bypass protection and realistic shading; financing also depends on an enforceable warranty and an insurable degradation model.
IEA PVPS’s 2025 report highlights multiple degradation pathways and the difficulty of representing tandem shading and spectral effects in standard testing. [8] A 2026 Nature Energy study reported certified efficiency of 33.76% and retention of more than 92% of initial efficiency after 1,000 hours at −15 V. [9] That is encouraging evidence for particular devices and stress conditions, not a 25-year lifetime result for arbitrary commercial modules. The matrix retains both experimental progress and the need for field validation.
Environmental value also needs a lifecycle boundary. Encapsulation and barrier materials, yield, solvents and energy use, lead containment and release after failure, collection logistics and recovery rates all belong in the assessment. We lack comparable product-level data to quantify carbon footprints or lead release here, so we do not rank products by unsupported environmental claims.
Commercialization gap / evidence matrix
Editorial analysis: absence in reviewed sources does not establish absence of capability. States are written explicitly.
| Dimension | Evidence status | Still to establish | Next step |
|---|---|---|---|
| Efficiency & area | Certified samples reported | Cell and module conventions differ [1][2][4] | Request stabilized power, area and batch distribution |
| Manufacturing & yield | Shipment disclosed | No audited batch-yield dataset in reviewed sources [3] | Request throughput, yield, scrap and repeated batches |
| Lifetime & shading | Specific laboratory progress | Stress tests do not replace long-term field data [8][9] | Multi-climate controls plus combined-stress tests |
| Price & financing | Cost advantage conditional | No transaction price or customer-return dataset [3] | Check warranty counterparty, insurance and quotations |
| Intellectual property | Licences disclosed | Geography and technology scope differ [5][6] | Review rights by product and geography |
| End of life & environment | No comparable product data reviewed | No carbon-footprint or release estimate here | Validate lead containment, recovery and LCA boundaries |
06 / Interactive economics: when does efficiency pay for its premium?
The model compares one square metre of module area for each technology. It separates module price per watt, area-related balance-of-system cost per square metre, power-related BOS per watt and annual operating cost per square metre. Both technologies receive the same annual irradiation and performance ratio; efficiency, geometric annual degradation and lifetime determine discounted energy. Area savings create value only where the corresponding costs actually scale with area.
All default prices, lifetimes, degradation rates and BOS costs are educational assumptions. Silicon is fixed at 23%, $0.12/W, 0.5% annual degradation and 25 years. The tandem starts at 24.5% efficiency, with other inputs adjustable below; that efficiency borrows a disclosed commercial milestone, not a current procurement specification. Taxes, incentives, tariffs, financing structure, inverter replacement, residual value, downtime and failure probability are excluded, and irradiation is constant. The result is a simplified discounted LCOE comparison, not a quotation or investment appraisal.
First hold lifetime and degradation equal and vary module price to inspect the efficiency premium. Then shorten tandem life or increase degradation to test whether the advantage survives. The break-even module price is only the price that produces the silicon baseline LCOE under the selected assumptions. It does not establish that a supplier can manufacture or deliver at that price.
Interactive economic sensitivity analysis
Scenario model · all costs, lifetimes and degradation rates are assumptions, not quotations. Comparison per m² in illustrative constant USD.
Efficiency × module price / LCOE change vs silicon
Negative values mean lower LCOE; positive values mean higher LCOE. Current degradation, lifetime, BOS, irradiation and discount assumptions apply. Columns are price; rows are tandem efficiency.
| η / $/W | $0.12 | $0.16 | $0.20 | $0.24 | $0.28 |
|---|---|---|---|---|---|
| 24% | +0.1% | +6.1% | +12.1% | +18.1% | +24.1% |
| 26% | -4.5% | +1.5% | +7.5% | +13.5% | +19.5% |
| 28% | -8.4% | -2.4% | +3.6% | +9.5% | +15.5% |
| 30% | -11.8% | -5.8% | +0.1% | +6.1% | +12.1% |
Show formulas, fixed assumptions and limitations
η is fractional efficiency, p module price, B_A area BOS, B_W power BOS, O annual operating cost, H annual irradiation, PR performance ratio, d annual degradation, r real discount rate and N lifetime. Cash flows are discounted at year-end; year one has no degradation.
C₀ = 1000η(p + B_W) + B_A  [$/m²]
Eₜ = HηPR(1 − d)^(t − 1)  [kWh/m²]
LCOE = (C₀ + Σ O/(1+r)^t) / Σ Eₜ/(1+r)^t
p* = (LCOE_Si × PV(E_T) − B_A − PV(O)) / (1000η_T) − B_W
Fixed: silicon 23%, $0.12/W, 0.5%/year, 25 years. Both have PR=0.85, power BOS=$0.15/W and O&M=$2/m²/year. Area BOS, irradiation and discount change for both. No taxes, incentives, residual value, replacement, failure or downtime model; spectral, bifacial and inverter-clipping differences are excluded.
07 / From research to product: an adoption framework
For constrained rooftops, design should compare energy per area, usable area, structural loading, fire requirements and wiring alongside price per watt. Utility projects may value efficiency differently once total investment per watt, terrain, mounting, bifacial response, spectrum, operations and financing terms are included. This is an inference from engineering and cost boundaries, rather than a validated ranking of segment returns.
A practical adoption path has three gates. Establish a specification using comparable certified measurements. Run controlled demonstrations across seasons and sites, recording anomalies, downtime and degradation. Then support larger procurement with batch yield, warranty responsibility, end-of-life arrangements and independent assessment. Each scale-up needs explicit stopping conditions, such as energy deviation or degradation beyond contractual thresholds; a press-release date is not a substitute for validation.
Tandems have credible efficiency and market-entry evidence. Their next source of value depends on translating experimental performance into a manufacturable, maintainable and financeable lifecycle product. Research teams can address stability and reproducibility together; industrial teams can reduce adoption risk through transparent product evidence.
08 / Sources, method and visual rights
Verification date: 16 October 2026. Journal papers support specific experimental findings; original company announcements support disclosed product and business events, not independent audits of returns. The links below allow inspection; full journal text may require access. All four visual groups are newly organized and drawn by Mgreen Lab from the cited sources; the economic model is an original implementation. No journal figures, Oxford PV photographs or other third-party images have been reproduced.
Citations paraphrase findings and report data. The original cover schematic is not an exact cross-section of a supplier device. Gaps and proposed tests in the commercialization matrix are editorial assessments, not certification verdicts. Updates should preserve original event dates and measurement conventions, add a new verification date and rerun the model and page checks.
- LONGi · 2025-04-22 · certified cell milestones ↗
- Oxford PV · 2024-06-19 · 26.9% designated-area module ↗
- Oxford PV · 2024-09-05 · first commercial shipment ↗
- Nature Communications · 2025 · 28.9% on 60 cm² active area ↗
- Oxford PV / Trinasolar · 2025-04-09 · China patent licence ↗
- Oxford PV / First Solar · 2026-02-24 · US patent licence ↗
- Oxford PV / Fraunhofer ISE · 2026-06-18 · matrix shingle modules ↗
- IEA PVPS Task 13 · 2025 · degradation and failure modes ↗
- Nature Energy · 2026 · reverse-bias stability ↗
- Nature Energy · 2017 · 23.6% monolithic tandem ↗
- Oxford PV · product roadmap · accessed 2026-10-16 ↗
钙钛矿–硅叠层光伏的关键问题,已从“能否提高转换效率”推进到“能否持续、可重复地把效率转化为发电价值”。本篇以截至 2026 年 10 月 16 日核验的一手公开资料为基础,比较研究器件、展示组件、商业交付与企业目标四类证据。所选数据是里程碑快照,不声称穷尽当日全球纪录。
Mgreen Lab 的判断:下一阶段的竞争单位将是可验证的产品系统——效率、良率、可靠性、系统成本、质保与回收路径需要共同成立。本文提出的采购与验证框架是编辑分析;交互模型是透明的情景计算,不代表厂家报价或实测电站收益。
01 / 为什么叠层有效,为什么它仍难制造
单结电池无法同样高效地利用整个太阳光谱。叠层把不同波段分配给不同带隙的吸收层:宽带隙钙钛矿在上、硅在下,以减少高能光子的热化损失,同时保留对较长波长光的利用。常见两端结构把子电池串联,因而需要电流匹配;光谱与温度变化会改变两层的相对输出,标称效率无法单独预测全年发电。
2017 年的一项研究已展示 1 cm²、23.6% 的单片两端叠层,并研究了阻隔层与湿热稳定性。[10] 此后界面钝化、透明电极与薄膜成膜不断改进,但将均匀薄膜覆盖到工业纹理硅片、维持低缺陷密度并兼容后续封装,仍属于另一组工程任务。因而比较成果时,必须同时询问面积、面积定义、结构、测试方法和认证状态。
02 / 效率对比:先看证据层级,再看百分比
下图在同一零起点坐标上显示效率,但按器件、组件与交付层级分组,不能据此把面积和测试口径不同的样品排成产品优劣榜。LONGi 于 2025 年 4 月报告经 NREL 认证的 34.85% 叠层电池与经 ISFH 认证的 27.81% 硅电池;同一公告也回顾了 2024 年 M6 尺寸叠层电池 30.1% 的进展。[1] 这些数字并非量产组件额定效率。
另一项 2025 年研究在 60 cm² 有源面积上取得 28.9% 认证效率,为面积放大提供了可量化证据。[4] Oxford PV 的 26.9% 是 2024 年 Fraunhofer CalLab 测量的展示组件指定面积效率;其当年首批商业组件公告给出的则是 24.5%。[2][3] 2026 年新展示的矩阵叠瓦组件报告 25.6% 全组件面积效率。[7] 这几个数的差别不应被解读为同一产品随时间退步。
效率数据对比 / 选定里程碑
转换效率 % · 共用 0–40% 轴;不同面积口径不能直接作为产品排名。
研究电池
展示组件
商业交付规格
03 / Oxford PV:商业交付证明了什么
Oxford PV 于 2024 年 9 月 5 日宣布向美国客户发出首批 72 电池叠层组件,电池来自德国 Brandenburg 的兆瓦级试验线,面向公用事业项目。[3] 这是实际市场进入的证据,但公告没有给出可审计的长期现场衰减、批量良率、公开成交价和客户收益数据。本文因此把它标为“企业披露的商业交付”,不把它升级为已经验证的全行业成本优势。
“最高多 20% 发电”的企业宣传也需要边界:它依赖比较对象、面积与运行条件。若只作同面积、相同辐照和相同系统损失的额定效率计算,24.5% 相对于 23% 的提升是 6.5%,相对于 21% 是 16.7%。这些是算术情景,不是该商业项目的现场测量。评估真实项目应使用当地光谱、温度、遮挡和逆变器条件下的年度发电数据。
04 / 产业化时间轴:研发、交付与授权是不同事件
产业化不是单一发布日期。效率认证回答样品性能,商业交付回答是否进入客户场景,专利授权回答某些知识产权使用权如何安排。2025 年 4 月 Oxford PV 与天合光能公布面向中国制造和/或销售的独家专利授权,并包含再授权权利。[5] 这类协议支持技术扩散,却不自动证明量产良率或最终组件产量。
2026 年 2 月与 First Solar 的美国非独家专利授权明确排除晶体硅半导体,因此不能写成 First Solar 购买了钙钛矿–硅叠层产线。[6] 同年 6 月与 Fraunhofer ISE 的叠瓦合作,则是组件互联与集成路径的进展。[7] 企业当前路线图中的 2027 年 27% 和 2030 年 30% 组件效率属于目标,而不是本文确认的交付规格。[11]
产业化时间轴 / 事件与目标分开
- 研究23.6% · 单片两端叠层 [10]
- 展示26.9% · 指定面积组件 [2]
- 交付美国客户首批商业交付 [3]
- 授权天合光能 · 中国专利授权 [5]
- 认证LONGi · 34.85% 叠层电池 [1]
- 授权First Solar · 明确排除晶体硅 [6]
- 展示25.6% · 全面积叠瓦组件 [7]
- 目标Oxford PV · 27% / 30% 组件路线图 [11]
05 / 商业化 Gap:把“缺什么证据”变成验证任务
证据矩阵并不是公司评分表,而是从公开资料推导的尽调框架。“未在本次来源中找到”不等于“企业没有”。效率纪录之外,采购方应索取批次分布、稳定功率与良率,组件端应验证互联、封装、旁路保护和实际遮挡条件;融资端还需要有履约能力的质保及可承保的长期衰减模型。
IEA PVPS 的 2025 年报告强调,新型组件存在多种退化途径,标准测试未必覆盖叠层在光谱与遮挡共同作用下的失效。[8] 2026 年 Nature Energy 的一项界面设计研究报告认证效率 33.76%,并在 −15 V、1,000 小时测试后保留超过 92% 初始效率。[9] 这是特定器件和应力条件的积极证据,不能外推为任意商用组件的 25 年寿命。矩阵因此将“已取得实验进展”和“仍待现场验证”同时保留。
环境价值也应以生命周期为单位评估。封装和阻隔材料、制造良率、溶剂与能耗、铅的约束与失效后释放、回收物流和回收率,都需要进入系统边界。本文没有足够的同口径数据量化不同产品的碳足迹或铅释放量,因此不绘制缺乏依据的绿色优劣排名。
商业化 Gap / 证据矩阵
编辑分析;“资料未提供”不等于“能力不存在”。状态通过文字表达,不依赖颜色。
06 / 交互经济性:效率溢价何时能抵消价格和衰减
模型按固定组件面积 1 m² 比较两种系统,分别计入每瓦组件价格、每平方米面积相关 BOS、每瓦功率相关 BOS 和每平方米年度运维成本。它将相同年度辐照量和系统性能比作用于两种技术,再以各自效率、年度几何衰减和寿命计算折现发电量。面积节约只有在相关支出确实按面积变化时才创造成本优势。
全部价格、寿命、衰减和 BOS 默认值均为教学假设。硅基准设为 23%/0.12 美元每瓦/0.5% 年衰减/25 年,叠层起点效率设为 24.5%,其余输入由下方控件调整;24.5% 仅借用公开商业里程碑,不代表当前可采购产品。模型排除税费、补贴、电价、融资结构、逆变器更换、残值、停机与失效概率,并假定年辐照不变,所以输出是简化的折现 LCOE 对比,不能代替项目报价或投资测算。
建议先保持同样寿命和衰减,仅改变组件价格来观察效率可支持的溢价,再缩短叠层寿命或增加衰减,检验优势是否消失。模型的“盈亏平衡组件价”只表示在选定假设下,与硅基准达到相同 LCOE 的价格;它不证明供应商能以该价格制造或交付。
交互式经济性敏感性分析
情景模型 · 全部成本、寿命和衰减均为假设;非报价。每平方米比较,货币统一为假设的实质美元。
效率 × 组件价格 / 相对硅基准的 LCOE 变化
负值表示 LCOE 较低,正值较高。保留当前衰减、寿命、BOS、辐照与折现假设。横轴为价格,纵轴为叠层效率。
| η / $/W | $0.12 | $0.16 | $0.20 | $0.24 | $0.28 |
|---|---|---|---|---|---|
| 24% | +0.1% | +6.1% | +12.1% | +18.1% | +24.1% |
| 26% | -4.5% | +1.5% | +7.5% | +13.5% | +19.5% |
| 28% | -8.4% | -2.4% | +3.6% | +9.5% | +15.5% |
| 30% | -11.8% | -5.8% | +0.1% | +6.1% | +12.1% |
展开公式、固定假设与适用边界
η 以小数表示,p 为组件价格,B_A 为面积 BOS,B_W 为功率 BOS,O 为年度运维,H 为年度辐照量,PR 为系统性能比,d 为年度衰减,r 为实质折现率,N 为寿命。年末折现,首年不施加衰减。
C₀ = 1000η(p + B_W) + B_A  [$/m²]
Eₜ = HηPR(1 − d)^(t − 1)  [kWh/m²]
LCOE = (C₀ + Σ O/(1+r)^t) / Σ Eₜ/(1+r)^t
p* = (LCOE_Si × PV(E_T) − B_A − PV(O)) / (1000η_T) − B_W
固定:硅 23%、$0.12/W、0.5%/年、25 年;两者 PR=0.85、功率 BOS=$0.15/W、运维=$2/m²/年。面积 BOS、辐照与折现率对两者同时改变。无税费、补贴、残值、更换、失效或停机模型;不考虑光谱、双面增益与逆变器限功率差异。
07 / 从研究到产品:Mgreen Lab 的采用框架
对于面积受限的屋顶,设计应同时比较单位面积发电、可安装面积、荷载、消防与布线,而不是只比较每瓦售价。对于大型电站,单位瓦总投资、地形与支架、双面增益、光谱、运维和融资条款可能改变效率溢价的价值。上述是基于成本与工程边界的分析判断,不是本次资料已经验证的细分市场收益排名。
可执行的路径是建立三个闸门:首先用同口径认证数据确认产品规格;其次以明确协议进行跨季节、多地点的对照示范,记录异常、停机和退化;最后以批次良率、质保责任、回收安排及独立评估支持规模采购。每次放大都应指定停止条件,例如发电偏差或退化超过合同阈值,而不是以新闻发布日期替代验证。
我们的结论是:叠层光伏已拥有可信的效率和市场进入证据,下一步价值取决于能否把实验性能变成可生产、可维护、可融资的生命周期产品。对研究团队,机会在于将稳定性与制造可重复性同时设计;对产业团队,机会在于用透明数据缩小客户的采用风险。
08 / 来源、方法与图像权利
核验日期:2026 年 10 月 16 日。期刊论文用于支持特定实验结论,企业原始公告用于支持其披露的产品与商业事件;没有将公告视为独立的收益审计。以下链接可供读者回查,期刊全文可能受访问限制。所有四组可视化均为 Mgreen Lab 根据所列来源重新组织与绘制,经济模型为原创算式实现;未复制论文图版、Oxford PV 照片或其他第三方图片。
文中引用为意译和数据转述。封面是原创结构示意,不代表厂商器件的精确截面。商业化矩阵中的缺口和建议为编辑判断,不是认证机构的通过/不通过结论。需要更新时,应保留原始事件日期与口径,新增核验日期,并重新运行下方模型与页面检查。
- LONGi · 2025-04-22 · certified cell milestones ↗
- Oxford PV · 2024-06-19 · 26.9% designated-area module ↗
- Oxford PV · 2024-09-05 · first commercial shipment ↗
- Nature Communications · 2025 · 28.9% on 60 cm² active area ↗
- Oxford PV / Trinasolar · 2025-04-09 · China patent licence ↗
- Oxford PV / First Solar · 2026-02-24 · US patent licence ↗
- Oxford PV / Fraunhofer ISE · 2026-06-18 · matrix shingle modules ↗
- IEA PVPS Task 13 · 2025 · degradation and failure modes ↗
- Nature Energy · 2026 · reverse-bias stability ↗
- Nature Energy · 2017 · 23.6% monolithic tandem ↗
- Oxford PV · product roadmap · accessed 2026-10-16 ↗