
AI数据中心耗电耗水:争议背后该算哪本账?
以IEA 2026年分析和微软冷却设计为线索,拆开总量与效率、现场与发电侧用水,说明社区和企业应索取哪些项目证据。
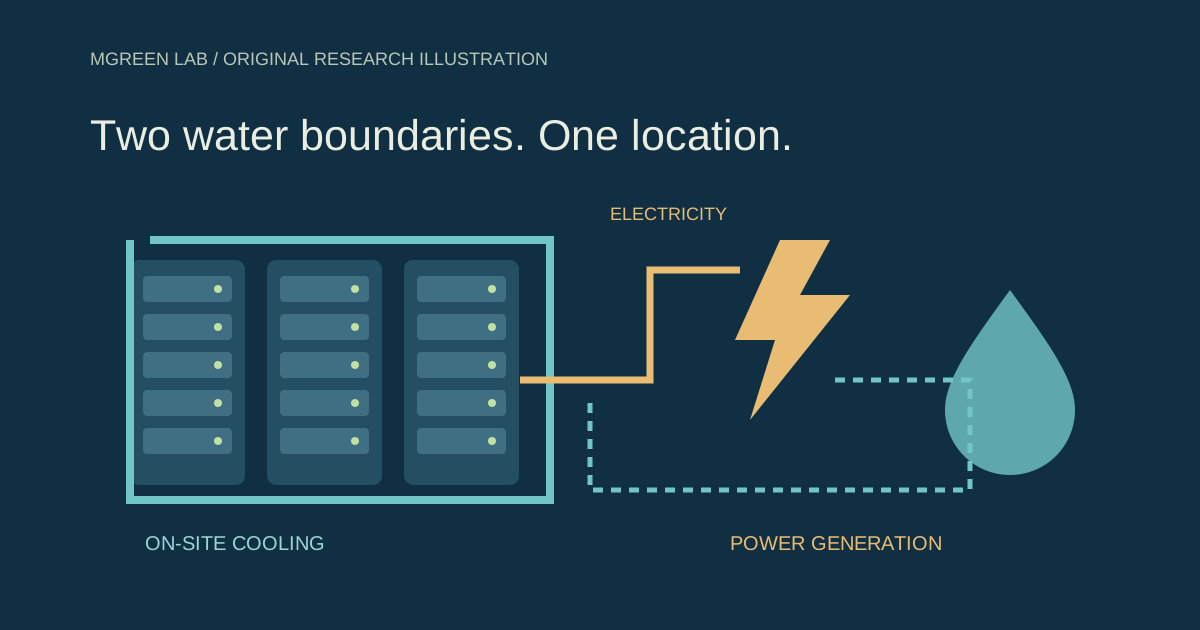
Topics & keywords
Resource debates around AI data centres require three answers: how much is used, where and when, and who pays. A low PUE, zero cooling-water claim or global percentage alone cannot resolve a local community’s concerns.
Sources checked on 24 October 2026. Institutional estimates, projections, company design disclosures and illustrative scenarios are separated. No fixed water-per-AI-query conversion is offered.
1. Lower intensity does not ensure lower demand
IEA’s 2026 analysis estimates global data-centre electricity use at about 485 TWh in 2025, reaching about 950 TWh in its central 2030 projection.[1] These figures cover all data centres, not AI alone; the first is an estimate and the second a projection, not realised growth.
Task efficiency can improve while volumes, model complexity and applications such as video raise total demand. Reducing redundant calls, selecting appropriate models and measuring useful-task cost can help, but a task benchmark cannot simply be scaled into a campus-wide saving pledge.
2. Water accounting has at least two boundaries
The first boundary is on-site withdrawal and consumption for cooling and other facility uses. The second is water associated with electricity generation. Withdrawal is water taken from a source; consumption is water not returned within the relevant boundary. Adding the two definitions does not produce a meaningful total.
Annual means can hide dry seasons and peaks. In a stressed basin, timing and source may matter more than national average intensity. Another 2026 IEA report highlights trade-offs between power supply, cooling and water.[2] Project assessment needs consistent local and temporal boundaries rather than stitched-together national averages.
Figure 1 · Global data-centre electricity: estimate and projection
| Year and evidence type | TWh |
|---|---|
| 2025 · Estimate | 485 |
| 2030 · Central projection | 950 |
3. What does zero-water cooling address?
In June 2026, Microsoft described a new design introduced in 2024 using closed-loop direct-to-chip cooling that consumes no water for cooling during operations.[3] That is a specific engineering boundary worth comparing with evaporative approaches.
The statement does not establish zero water use for the entire facility, every existing site or the supply chain. Assessment should also check initial filling, other site uses, electricity generation, equipment manufacture and energy changes under different climates. A corporate design disclosure is not an independent annual audit of every facility.
4. A reproducible annual boundary model
The illustration starts with average IT load. PUE converts IT electricity into facility electricity. On-site WUE uses litres consumed per kWh of IT electricity; the power-sector factor uses litres consumed per kWh of facility electricity. They can be added only when both describe consumption without overlap.
Default assumptions—10 MW average IT load, 8,760 hours, PUE 1.2, on-site 0.2 L/kWh IT and power-sector 0.5 L/kWh facility—produce 105.12 GWh of annual facility electricity, 17.52 million litres on site and 52.56 million litres at generation. All are illustrative inputs, not local industry averages or permit limits.
Figure 2 · Two consumption paths with different denominators
MW × 1000 × h
IT kWh × on-site WUE → site litres
IT kWh × PUE × power water factor → generation litres
Add only non-overlapping consumption; report withdrawal separately. Check local basin and dry-season conditions.
Interactive · Change assumptions, not a forecast
IT kWh=MW×1000×h; facility kWh=IT×PUE; site L=IT×WUE; generation L=facility×factor.
5. Will household electricity bills rise?
The answer depends on grid investment, use of existing capacity, connection arrangements and cost allocation. IEA notes that socialising new infrastructure costs can burden other users, while using spare capacity and paying an appropriate share can produce a different outcome.[2] Load size alone does not establish a rise or fall in household tariffs.
Project communication should disclose connection timing, peak demand, interruptibility, payment commitments and exit responsibilities. Water communication should explain dry-season constraints, site sources and contingency arrangements. Employment or investment pledges cannot substitute for these terms.
Worksheet · Which evidence remains unconfirmed?
6. Turn controversy into answerable project questions
For an operator, useful deliverables may be a boundary-consistent resource disclosure, design comparison and community question set rather than a green-AI label. Enterprise buyers can first check the region, period and definitions behind supplier disclosures, then assess task efficiency.
Mgreen Lab can discuss bounded research on resource-information design, public communication and product decision tools. The worksheet identifies missing information; it does not replace hydrological, grid or environmental-impact assessment.
Take the worksheet and define a concrete need
Download bilingual worksheet (Markdown)
Discuss requirements with Mgreen Lab7. Judgement and source register
A credible discussion can recognise improving efficiency alongside real local pressures from rapid expansion. Project evidence needs boundaries, geography, timing and responsibility rather than a single favourable metric.
Evidence and boundaries
- IEA — Key Questions on Energy and AI, executive summary2026 · Accessed: 2026-10-24All data centres; estimates and projections, not AI-only demand or realised 2030 consumption.
- IEA — Powering Artificial Intelligence, executive summary2026 · Accessed: 2026-10-24Cross-jurisdiction analysis; local effects depend on connection, generation, basin and cost allocation.
- Microsoft — Inside Microsoft’s two-decade push to cut water intensity while scaling for growth2026-06-24 · Accessed: 2026-10-24Limited to operational cooling in the new design; not zero facility/value-chain water or independent measured assurance.
Related: Green material value · Repair service economics
AI 数据中心的资源争议,需要同时回答三个问题:用了多少、在何地何时使用、成本由谁承担。单独拿出一个低 PUE、零冷却用水或全球占比,都不足以回答当地社区的担忧。
本文截至2026年10月24日核验资料,区分机构估计、未来预测、公司设计披露与演示情景,不提供“每问一次AI固定耗水多少”的换算。
一、效率下降的是强度,总量未必下降
IEA 2026年分析估计,全球数据中心2025年用电约485 TWh,2030年中心情景约950 TWh。[1] 这比较的是所有数据中心,而非AI单独用电;前者是估计,后者是预测,不能画成已经发生的增长。
单次任务更省电,同时任务数量、模型复杂度和视频等应用增加,总需求仍可能上升。对企业来说,减少重复调用、选择合适模型和衡量有效任务成本都有意义,但不能把单次测试直接放大成整个园区的节能承诺。
二、用水账至少有两条边界
第一条是现场取水与消耗,涉及冷却、设施及当地供水;第二条是购电所对应的发电侧用水。取水指从水体取出的量,消耗指没有在同一边界返回的量,两者不能相加后称为“总耗水”。
年度平均还会遮住旱季和高峰。在水资源紧张流域,时间和水源可能比全国平均强度更重要。IEA另一份2026年报告强调供电、冷却及水资源的权衡。[2] 项目判断需要同地点、同期间的口径,而不是不同国家平均数的拼接。
图1 · 全球数据中心用电:估计与预测
| 年份与证据类型 | TWh |
|---|---|
| 2025 · 估计 | 485 |
| 2030 · 中心预测 | 950 |
三、零冷却用水设计,解决了哪一部分?
微软2026年6月说明,其2024年引入的新数据中心设计通过闭式直接到芯片冷却,在运行冷却过程中不消耗水。[3] 这是明确的工程边界,值得与蒸发式方案比较。
这一描述不能扩大为整个设施、所有现有站点或供应链都零用水。评估还要核对系统首次充液、其他现场用途、发电侧、设备制造,以及不同气候下的电耗变化。企业披露说明设计意图,不等于每座设施已有独立年度审计。
四、一个可复算的年度边界模型
下面的演示从平均IT负荷开始,PUE将IT电量转换为设施电量;现场WUE使用每kWh IT电量对应的消耗升数,发电侧因子使用每kWh设施购电对应的消耗升数。只有在两项都采用消耗口径且不重叠时,才可以相加。
默认10 MW平均IT负荷、8760小时、PUE 1.2、现场0.2 L/kWh IT、发电侧0.5 L/kWh设施电量,得到105.12 GWh设施年电量、1752万升现场和5256万升发电侧消耗。全部是演示假设,不是某地行业均值或项目许可指标。
图2 · 两条水消耗路径,分母不同
MW × 1000 × h
IT kWh × 现场WUE → 现场消耗升
IT kWh × PUE × 电力水因子 → 发电侧消耗升
仅相加不重叠的消耗;取水单独报告。当地流域与旱季条件另核查。
交互 · 只改变假设,不预言结果
IT kWh=MW×1000×h; facility kWh=IT×PUE; site L=IT×WUE; generation L=facility×factor.
五、居民电费会不会被推高?
答案取决于新增电网投资、既有容量利用、接入安排以及费用分摊。IEA指出,把新增基础设施成本社会化可能增加其他用户负担;如果利用已有容量并承担合理份额,结果可以不同。[2] 因此,不能只凭用电规模就断言居民电价必涨或必降。
项目沟通应提供接入时间、峰值负荷、可中断能力、付款承诺和退出责任,水资源沟通则给出旱季约束、现场水源和应急安排。就业或投资承诺不能替代这些具体条件。
工作表 · 哪些证据还没确认?
六、把争议变成可回答的项目问题
对运营方,最有价值的交付物可能是一套边界一致的资源披露、方案比较图与社区问答,而不是一个漂亮的“绿色AI”标签。对采用AI的企业,可先核查供应商披露的区域、周期和计算口径,再评估任务效率。
Mgreen Lab 可围绕资源信息可视化、公众沟通和产品决策工具讨论范围明确的研究需求。下方工作表帮助整理缺口;它不替代水文、电网或环境影响的专业评估。
带走工作表,讨论一个明确需求
与Mgreen Lab讨论需求七、结论与核查资料
负责任的讨论应同时保留两件事实:数据中心可以改善效率,快速扩张也可能带来真实的地方资源压力。可信的项目证据要说明边界、地点、时段与责任,而非只选择最有利的一个指标。
证据与适用边界
- IEA — Key Questions on Energy and AI, executive summary2026 · 访问:2026-10-24全部数据中心;估计与预测,不是AI单独用电或已经实现的2030结果。
- IEA — Powering Artificial Intelligence, executive summary2026 · 访问:2026-10-24跨地区分析;当地影响依赖接入、电源、流域和成本分摊。
- Microsoft — Inside Microsoft’s two-decade push to cut water intensity while scaling for growth2026-06-24 · 访问:2026-10-24只限新设计运行冷却;非设施或价值链零水足迹,非独立实测审计。