
Why efficient heat pumps do not always save money: field performance and delivery economics
Field evidence, 2026 market analysis and UK installation experience explain how seasonal performance, electricity-to-gas prices and retrofit costs determine heat-pump savings.
Topics & keywords
Heat-pump savings depend on heat delivered over a season, relative electricity and gas prices, and the incremental cost of a working installation in the actual building. Efficiency creates an opportunity; heat emitters, controls and verifiable delivery determine whether it reaches the bill.
Evidence reviewed through 23 October 2026. This is Mgreen Lab analysis of external research and project records, not an in-house heat-pump trial. Model inputs are scenarios in a consistent currency, not current local quotations.
1. A recovering market does not make every project economic
IEA’s July 2026 Heat Pump Monitor describes double-digit European growth in 2025 alongside stabilising global building heat-pump sales. Upfront spending and electricity prices relative to fossil fuels remain deployment constraints.[1] Market direction and a household investment decision therefore need separate tests.
Ask how much a system saves each year at equivalent comfort, hot-water demand and weather, and how much extra the household must pay. A nameplate comparison can omit emitters, storage, electrical work and commissioning; a bill-only comparison can mistake a comfort change for an efficiency gain.
2. What field measurements establish—and what they do not
Fraunhofer ISE’s WP-QS project monitored 77 residential installations. Its main 2024 evaluation covered 49 air-source systems with SPF 2.6–4.9, averaging 3.4, and 13 ground-source systems with SPF 3.6–5.4. Building age did not correlate with efficiency in this sample.[2] A 2026 proceedings abstract gives a ground-source mean of 4.3 and defines SPF as generator efficiency for combined space heating and domestic hot water.[3]
This supports the feasibility of good performance in older buildings, while leaving retrofit needs to be assessed individually. Supply temperature and building conditions matter when transferring the finding. The plotted ranges are observed minima and maxima, not confidence intervals; heat sources were not randomised, so the mean difference is not a causal gain from changing source.
3. Monitoring creates value when deviations become actionable
A 2025 Nature Communications study analysed 1,023 systems from one manufacturer. Efficiency classification used 708 systems with adequate fits: 612 air-source and 96 ground-source, of which 105 and two respectively fell below the applied thresholds. It covers space heating and uses device-derived energy estimates rather than wholly independent metering.[4]
Its standardised metric should not be pooled with annual SPF above. A more useful product implication is a closed service loop: detect deviations, explain plausible causes, arrange installer review, then verify comfort and consumption. A warning alone is not an energy-saving service; false alarms and unresolved alerts can add customer work.
4. Delivery evidence: the product includes emitters and aftercare
The UK Electrification of Heat installation report records 742 systems: 93% of participating installed homes needed at least one radiator replaced and 81% needed new thermal storage. Published in 2022, these are historical demonstration-project requirements, not current market rates or prices; contractor differences also limit some comparisons.[5]
Delivery contractor Warmworks reports 305 installations in southeast Scotland, followed by monitoring and optimisation support.[6] This is an example of delivered installations and service. Its impact descriptions remain company disclosures rather than independently audited savings guarantees. Field-performance variation explains why service capability belongs in procurement.
Break quotations into an accountable service: heat-load and emitter assessment, equipment and hydraulics, installation and reinstatement, commissioning, metering and first-season review. Assign responsibility before comparing complete-system offers. Cheap equipment in a mismatched system can shift the initial saving into continuing energy and complaint costs.
Figure 2 · The evidence gap from research to procurement
| Question | Evidence available | Still not established |
|---|---|---|
| Operable | 2024 measured SPF | No guarantee for every building |
| Installable | 742 UK demonstration installs | Not retrofit-free or current prices |
| Serviceable | 305 installs disclosed by Warmworks | Not an independent savings audit |
| Worth investing | Local offer + measurement + cash flow | Needs local prices and acceptance data |
Mgreen Lab editorial synthesis of [2][3][5][6]. Records from the same programme are not independent replications.
5. The fuel-cost boundary: the price ratio must be below SPF/η
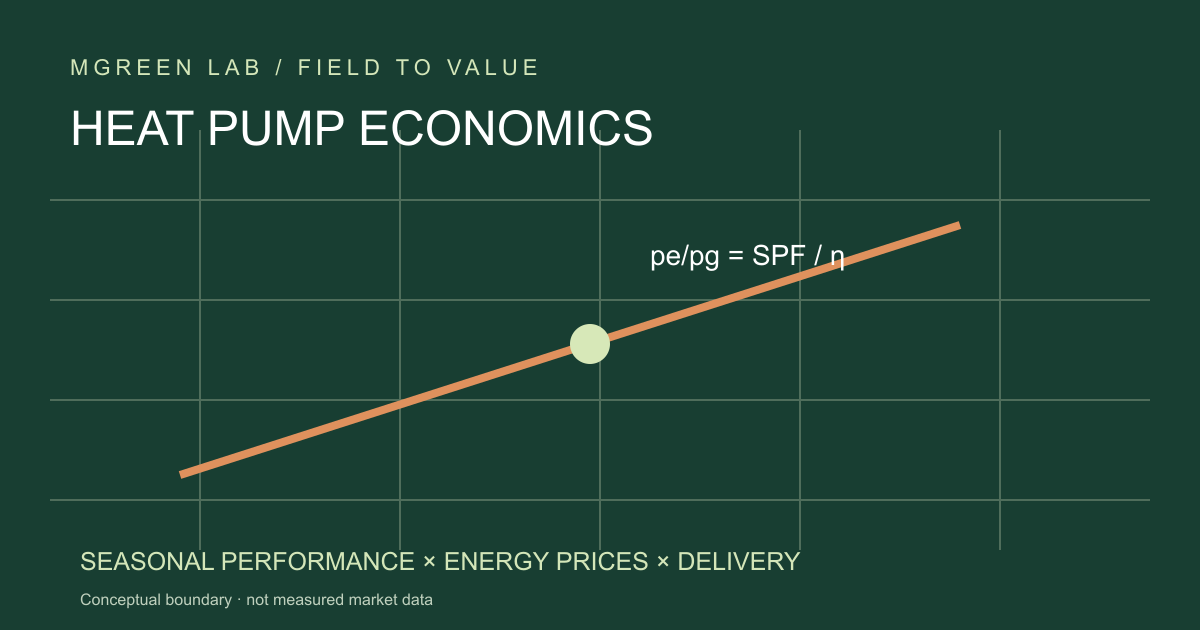
For equal annual useful heat Q, heat-pump electricity costs Q×pe/SPF and boiler fuel costs Q×pg/η. Electricity and gas-input prices pe and pg use the same currency per kWh; η is seasonal boiler efficiency. Lower heat-pump fuel cost requires pe/pg < SPF/η. Gas calorific-value conventions must match η, and heat-pump electricity must include auxiliaries appropriate to the comparison.
With Q=12,000 kWh of useful heat/year, pe=0.30, pg=0.08, SPF=3.4 and η=0.90, annual fuel costs are 1,058.82 and 1,066.67 currency units, a difference of only 7.84. The threshold price ratio is 3.78 versus an input ratio of 3.75. Seasonal efficiency above three can still yield almost no fuel-bill advantage in this hypothetical tariff structure.
Changing only pe to 0.20 produces annual savings of 360.78; keeping the original tariff but raising SPF to four yields 166.67. These are scenarios, not promises. Time-of-use operation can change the weighted electricity price, but also temperatures, losses and SPF; the cheapest tariff and best efficiency cannot be combined without checking that the control strategy can deliver both.
Figure 3 · How prices and performance change fuel cost
Scenario: boiler fuel cost=100, η=0.90. Cells show relative heat-pump cost; below 100 saves fuel cost. SPF values are scenario points drawn from field ranges, not new measurements.
| pe/pg | SPF 2.6 | SPF 3.4 | SPF 4.3 |
|---|---|---|---|
| 2 | 69.2 | 52.9 | 41.9 |
| 3 | 103.8 | 79.4 | 62.8 |
| 3.75 | 129.8 | 99.3 | 78.5 |
| 4 | 138.5 | 105.9 | 83.7 |
| 5 | 173.1 | 132.4 | 104.7 |
100 × (pe/pg) × η / SPF. Original scenario calculation; installation and fixed charges excluded.
6. Fuel savings still need an investment case
The model separates net incremental installation cost ΔK from annual fuel savings S. Simple payback ΔK/S is meaningful only for S>0. At the default ΔK=4,000, payback is about 510 years, far beyond a normal equipment decision horizon; with pe=0.20 it is about 11.1 years. This is no lifetime prediction: a thin operating advantage cannot support a large upfront premium.
Compare complete alternatives at the same replacement date and subtract only available grants from ΔK. The tool excludes discounting, maintenance, replacement, gas standing charges, finance, cooling value and carbon costs. Avoided standing charges count only if the gas connection is actually removed; continued gas cooking can prevent that saving. Zero or negative fuel savings display no positive payback rather than a negative number of years.
Interactive · Fuel costs and simple payback for equal heat
C_HP = Q × pe / SPF; C_gas = Q × pg / η; S = C_gas − C_HP; P = ΔK / S (S > 0).
Hypothetical inputs in one currency. Ranges are tool limits, not certified technology limits. Fuel costs and simple payback only: no discounting, fixed charges, maintenance, replacements, cooling or carbon costs. Match η to gas calorific-value conventions and include relevant auxiliaries in SPF. No positive payback at Q=0 or S≤0.
7. Carbon and cost require explicit, separate boundaries
For grid-emission factor ge and gas-combustion factor gg, lower operational emissions require ge/SPF < gg/η for equal useful heat. Cost and carbon need not move together: tariffs include taxes and market structure, while emissions reflect energy supply. Annual averages cannot determine the marginal emissions of shifting a particular operating hour.
This is still not a lifecycle comparison. Equipment production, refrigerant leakage and recovery, drilling or installation materials, replacements and future grid changes need separate inventories. German field findings do not establish a Chinese household’s emissions reduction, and this fuel-cost tool is not a lifecycle-cost model. Missing local evidence remains an open requirement.
8. Adoption needs a verifiable delivery commitment
Priority candidates can meet comfort needs at low supply temperatures, already have suitable emitters, face a sensible replacement window and retain operating-cost headroom under local tariffs. Tight space, noise, electrical-capacity or disruption constraints require feasibility work first. Building age can guide questions but cannot replace a site assessment.
Ask four acceptance questions: are design heat load and supply temperature documented; does metering cover promised electricity boundaries; will first-season performance be reviewed alongside weather and comfort; and who investigates and recommissions deviations? Product and design-management teams can put these into a service process more usefully than an unbounded maximum-savings percentage.
Heat-pump value resides both in the machine and in the capability to connect a building, its energy prices and continuing service. When performance commitments become measured results under equivalent conditions, customers can judge whether the heating solution fits their needs.
Sources, boundaries and related reading
- Heat Pump Monitor 2026 — Key findingsIEA · 2026-07-28 · Official market analysis / 官方市场分析 · Accessed 2026-10-23Regional trends differ. No local household tariffs or guaranteed savings / 区域趋势不同,不提供当地家庭价格与节费保证。
- HP-QA in Existing Buildings (WP-QS im Bestand)Fraunhofer ISE · 2025-11-03 (results announced; project page undated) · Instrumented field project / 仪表实测项目 · Accessed 2026-10-232024 analysis subset differs from full cohort. Range is not a confidence interval; observational, no randomised comparison / 评估子样本不同于全部设备,区间非置信区间,非随机试验。
- Detailed efficiency analysis for heat pumps in existing singlefamily houses within a large-scale field testIEA HPT conference proceedings catalogue · 2026-05-26 · Proceedings abstract / 会议论文摘要 · Accessed 2026-10-23Public abstract read, full proceedings not read. Same Fraunhofer cohort as source 2, not independent replication / 仅读公开摘要,与来源2为同一队列,不是独立重复验证。
- Estimation of energy efficiency of heat pumps in residential buildings using real operation dataNature Communications 16, 2834 · 2025-03-22 · Peer-reviewed observational study / 同行评审观察研究 · Accessed 2026-10-23Device-computed energy, space heating, H3 boundary. Model-standardised SCOPreal not annual combined-service SPF; selected fit-qualified subset. Not representative failure rate / 设备推算能量、供暖H3边界、标准化指标、拟合子样本,不代表市场故障率。
- Electrification of Heat — Home Surveys and Install ReportEnergy Systems Catapult · 2022-12-20 · Government-funded demonstration / 政府资助示范 · Accessed 2026-10-23Historical installation phase; contractor differences; public report landing-page findings read, gated PDF not read. No current market-cost inference / 历史示范,承包商方法不同,仅读公开报告摘要而非表单后PDF,不推断当前市场成本。
- Electrification of heat demonstration project in ScotlandWarmworks · Undated; describes installations 2020–2021 and monitoring to 2023 · Contractor disclosure / 承包商披露 · Accessed 2026-10-23Company account, not independent audit of savings. Same UK programme as source 5 / 企业叙述,非节费独立审计,与来源5属同一项目。
Why does green technology need design management? · Ask lifecycle questions at the beginning
Original Mgreen Lab writing, charts, diagram and scenario model. Data attributed to linked sources; no third-party photos or journal figures reproduced.
热泵能否省钱,取决于整季交付的热量、电费与燃气费的相对价格,以及为这套建筑真正装好系统所需的增量投入。高效率创造机会;低温末端、合适的控制与可验证的交付,决定机会能否落到账单上。
资料核验截至 2026 年 10 月 23 日。本文为 Mgreen Lab 对外部研究与项目资料的分析,不是本机构开展的热泵试验。模型参数是情景假设,使用相同货币单位,不是任何地区的现行报价。
1. 市场复苏不等于每个项目都划算
IEA 于 2026 年 7 月发布的 Heat Pump Monitor 指出,2025 年欧洲市场实现两位数增长,但全球建筑热泵销售整体趋于稳定。它同时把初始费用和电力相对化石燃料的价格,列为部署的重要约束。[1] 因此,市场方向与单个家庭的投资判断需要分开。
一个实用问题是:在同样的室温、热水需求和气候条件下,新系统每年少花多少钱,家庭为此需要多支付多少?如果只比较设备铭牌,散热器、水箱、配电和调试可能在报价之外;如果只比较账单,室温变化又可能被误认作效率收益。
2. 实测告诉我们什么,又没有告诉我们什么
Fraunhofer ISE 的 WP-QS 项目监测了 77 套既有住宅热泵。2024 年主要评估中,49 套空气源系统的 SPF 为 2.6–4.9、平均 3.4;13 套地源系统为 3.6–5.4。项目报告没有发现建筑年代与效率的相关性。[2] 2026 年会议论文摘要补充地源平均值为 4.3,并把 SPF 明确为供暖与生活热水合计的热源设备效率。[3]
这支持“旧建筑也可能运行良好”,不支持“所有旧建筑都无需改造”。样本的供水温度与建筑条件才是转移结论时应检查的变量。图中区间是已观测最小值到最大值,不是置信区间;两种热源没有随机分配,均值差不能当作更换热源的因果收益。
3. 数字监测的价值,是找到可处理的偏差
2025 年 Nature Communications 研究分析了单一制造商的 1,023 套系统;效率分级实际使用 708 套拟合合格系统,包括 612 套空气源和 96 套地源。模型标准化 SCOPreal 低于所用门槛的分别有 105 套和 2 套。它聚焦空间供暖,输入能量由设备传感器推算,并非全部独立热量表测量。[4]
因此,这篇研究的标准化指标不与上一节的年度 SPF 合并排名。对产品团队更有用的启发,是把监测设计成闭环:识别偏差、解释可能原因、安排安装商复核,再确认舒适度与能耗是否改善。一个红色告警本身不是节能服务,误报和无人处理的告警还会增加用户负担。
4. 交付案例:真正的产品包含散热器与售后
英国 Electrification of Heat 的安装报告记录了 742 套系统:已安装家庭中,93% 至少更换一个散热器,81% 需要新的蓄热装置。报告发表于 2022 年,说明的是当时示范项目的改造工作量,不是今日全市场比例或报价;不同承包商的方法也限制部分结果的直接比较。[5]
交付商 Warmworks 披露,它在苏格兰东南部完成 305 户安装,之后跟踪运行并提供优化支持。[6] 这构成实际安装与服务的案例;其效果描述仍是企业自述,不能视为独立审计的节费保证。研究发现的运行差异,恰好解释为什么服务能力需要进入采购范围。
报价应按一套可验收的服务拆解:热负荷与末端核查、设备与水力系统、施工与恢复、调试、计量和首个供暖季复核。各项明确责任方,才能比较两份“整套”报价。把便宜设备装进不匹配的系统,可能把节省的采购费转化成长期电费和投诉成本。
5. 省钱边界:电气价格比必须低于 SPF/η
对同样的年度有用热量 Q,热泵电费为 Q×pe/SPF,燃气锅炉燃料费为 Q×pg/η。pe 与 pg 分别是每 kWh 电力与燃气输入的同币种价格,η 为锅炉季节效率。热泵燃料费较低的条件是 pe/pg < SPF/η。燃气热值口径必须与 η 一致;热泵系统电耗边界也应包含比较所需的辅机。
示例设 Q=12,000 kWh热/年、pe=0.30、pg=0.08、SPF=3.4、η=0.90。热泵与锅炉年燃料费分别约 1,058.82 和 1,066.67,差额仅 7.84 货币单位;边界价格比为 3.78,而输入价格比已达 3.75。高于 3 的季节效率,在这个假设价格结构下仍几乎没有燃料费优势。
若只把电价改为 0.20,年节省变为 360.78;若维持原电价、把 SPF 提至 4,年节省为 166.67。这些是同一公式的情景,不是承诺。分时电价可改变加权购电成本,但移峰也可能改变水温、损耗和 SPF;不能同时取最便宜电价与最理想效率,却不验证控制策略能否兼得。
图 3 · 价格与性能怎样改变燃料费?
情景:锅炉燃料费=100,η=0.90。表中为热泵相对费用;低于100才省燃料费。SPF数字借自实测范围作情景点,并非新测量。
| pe/pg | SPF 2.6 | SPF 3.4 | SPF 4.3 |
|---|---|---|---|
| 2 | 69.2 | 52.9 | 41.9 |
| 3 | 103.8 | 79.4 | 62.8 |
| 3.75 | 129.8 | 99.3 | 78.5 |
| 4 | 138.5 | 105.9 | 83.7 |
| 5 | 173.1 | 132.4 | 104.7 |
100 × (pe/pg) × η / SPF. 原创情景计算;不含安装与固定费用。
6. 从燃料费优势到值得投入,还差一张现金流表
交互模型将净增量安装投入 ΔK 与年燃料节省 S 分开。只有 S>0 时,简单回收期 ΔK/S 才有意义;默认 ΔK=4,000 时回收期约 510 年,远超通常设备决策期限。将电价改为 0.20 后约为 11.1 年。这不是寿命预测,而是提醒读者:很薄的运行优势不足以支撑显著的前期溢价。
ΔK 应比较相同更换时点的完整方案,并扣除实际可获得的补助。模型未计折现、维修、替换、燃气固定费、融资、制冷价值或碳成本。若燃气连接确实取消,固定费节省可另行加入;如果仍用燃气做饭,就不能默认这笔节省。零或负的燃料节省会显示“无正向回收”,而不是负年数。
交互 · 同一供热任务的费用与简单回收期
C_HP = Q × pe / SPF; C_gas = Q × pg / η; S = C_gas − C_HP; P = ΔK / S (S > 0).
参数为假设,统一币种;范围是工具输入限制,不是技术认证边界。仅燃料费与简单回收期,不含折现、固定费、维修、更换、制冷或碳成本。η与燃气热值口径一致,SPF须包含比较需要的辅机。Q=0或S≤0时无正向回收。
7. 减碳与省钱,应使用两套清楚的边界
同样的运行热量,若电网排放因子为 ge、燃气燃烧因子为 gg,运行减排条件是 ge/SPF < gg/η。这个式子解释了省钱和减碳为何不必同时发生:价格包含税费与市场结构,排放取决于能源组合。年度平均因子也不能回答某个时段移峰的边际排放问题。
这仍不是生命周期比较。设备生产、制冷剂泄漏与回收、钻井或安装材料、替换次数和电网未来变化,都需要另设清单。本文不把德国项目的结果套用为中国家庭的减排百分比,也不把节费模型输出称作生命周期成本。当地数据缺失时,应该保留待验证项。
8. 值得采用的条件,是一份能验证的交付承诺
优先评估的场景,是在舒适度不下降的前提下能以较低供水温度供热、已有合适末端、替换窗口合适,且价格比给运行成本留下余量的建筑。空间、噪声、供电容量或施工扰动约束很强时,应先评估可行改造方案。建筑年代可以提示调查方向,不能替代现场核查。
交付验收可围绕四个问题:是否记录设计热负荷与供水温度;计量是否覆盖承诺的耗电边界;首个供暖季是否在记录天气与舒适度的同时复核性能;偏差出现后谁负责复查与调试?对于产品与设计管理团队,这些比一个没有边界的“最高节省”百分比更适合写进服务流程。
热泵的商业价值不只存在于压缩机里,也存在于把建筑、能源价格与售后服务接起来的能力里。当效率承诺能够转化成同条件的实测结果,客户才能判断自己购买的是合适的供热方案。
来源、口径与延伸阅读
- Heat Pump Monitor 2026 — Key findingsIEA · 2026-07-28 · Official market analysis / 官方市场分析 · 访问 2026-10-23Regional trends differ. No local household tariffs or guaranteed savings / 区域趋势不同,不提供当地家庭价格与节费保证。
- HP-QA in Existing Buildings (WP-QS im Bestand)Fraunhofer ISE · 2025-11-03 (results announced; project page undated) · Instrumented field project / 仪表实测项目 · 访问 2026-10-232024 analysis subset differs from full cohort. Range is not a confidence interval; observational, no randomised comparison / 评估子样本不同于全部设备,区间非置信区间,非随机试验。
- Detailed efficiency analysis for heat pumps in existing singlefamily houses within a large-scale field testIEA HPT conference proceedings catalogue · 2026-05-26 · Proceedings abstract / 会议论文摘要 · 访问 2026-10-23Public abstract read, full proceedings not read. Same Fraunhofer cohort as source 2, not independent replication / 仅读公开摘要,与来源2为同一队列,不是独立重复验证。
- Estimation of energy efficiency of heat pumps in residential buildings using real operation dataNature Communications 16, 2834 · 2025-03-22 · Peer-reviewed observational study / 同行评审观察研究 · 访问 2026-10-23Device-computed energy, space heating, H3 boundary. Model-standardised SCOPreal not annual combined-service SPF; selected fit-qualified subset. Not representative failure rate / 设备推算能量、供暖H3边界、标准化指标、拟合子样本,不代表市场故障率。
- Electrification of Heat — Home Surveys and Install ReportEnergy Systems Catapult · 2022-12-20 · Government-funded demonstration / 政府资助示范 · 访问 2026-10-23Historical installation phase; contractor differences; public report landing-page findings read, gated PDF not read. No current market-cost inference / 历史示范,承包商方法不同,仅读公开报告摘要而非表单后PDF,不推断当前市场成本。
- Electrification of heat demonstration project in ScotlandWarmworks · Undated; describes installations 2020–2021 and monitoring to 2023 · Contractor disclosure / 承包商披露 · 访问 2026-10-23Company account, not independent audit of savings. Same UK programme as source 5 / 企业叙述,非节费独立审计,与来源5属同一项目。
绿色技术为什么需要设计管理? · 在产品起点提出生命周期问题
图表、示意图、文章与情景模型由 Mgreen Lab 原创;数值按链接来源注明,未转载第三方照片或论文图。